
One Metric To Rule Them All
If you could track just one metric for your team, what would it be?
The one metric I would certainly NOT choose is story point velocity. When managers use ‘velocity’ as a measure of team performance, teams will game the system. It’s human nature. Whether unconsciously or deliberately, if I know my boss is monitoring ‘velocity’, I will manipulate that number to my advantage, and I can do it easily. First, I’ll inflate my story point estimates. Secondly, I’ll cut corners on quality to get things ‘done’ — or at least, claimed to be done. This dysfunction gets even worse when it’s used to measure an individual’s performance.
The metric that I would choose is cycle time: the total time from start to finish for each backlog item. Here are the reasons:
Cycle time is simple
All you need to measure cycle time is to track the date and time each item is started and completed. That’s it. Most tools will do this by default, so all you need to do is accurately update the status of each work item.
Cycle time is objective
Unlikely subjective story points, cycle time is purely objective. Unless you are sloppy or fraudulent, it’s clear and undeniable.
Cycle time incentivizes efficiency
The way to improve cycle time is to examine the entire workflow and relentlessly eliminate waste and delay. Optimizing for cycle requires simplifying processes, reducing handoffs and finding innovative ways to parallelize more work.
Cycle time enables forecasting without estimating
How many times has someone asked you “How long will this take to get done?” If you’ve measured cycle time for a sufficient number of items, you can easily answer that question statistically, and with confidence. Consider the sample scatter plot below, showing the cycle time for each item completed, along with the date it was completed.

This plot shows that we will complete an item in 12 days or less with 85% confidence. So my forecast is that it will take 12 days or less. Period.
Another common forecasting question is “how many items can we complete by date X?” With a sufficient amount of cycle time data, we can also answer that question statistically and with confidence, using monte carlo simulation. Monte carlo analysis runs multiple simulations (trials), each with a different combination of items with different cycle times. Some simulations will include more small items, some simulations include more large items. All of this is based on the actual cycle time distribution in your historical data. See the histogram below for example.
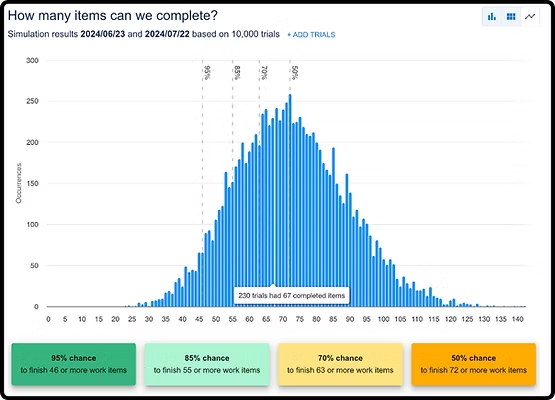
The graph above tells us there is an 85% chance that we will complete 55 (or more) items by the date selected. If you want 95% confidence, then you can forecast that you’ll complete 46 or more items in the same time frame. None of this requires estimation! It is all based on actual data collected historically, and you only need to collect two data points: start time and end time. If you’re looking for a tool to do this monte carlo analysis for you, check out ActionableAgile®.
Cycle time works great to measure the impact of AI adoption
In this AI hype cycle, leaders are asking how they can measure ‘AI adoption’. Some suggest measuring how much code is written by AI, or how many work items / widgets are created with AI. These output-oriented intermediary don’t measure what actually matters. They are proxy measures which can have the unintended consequence of driving people to use AI in silly ways just to make the metric look good. The real reason for using AI is to get work done faster — to reduce cycle time.
Don’t settle for only one metric
Of course you don’t have to choose only one metric, and you shouldn’t. A myopic focus on cycle time can drive poor behavior; people may choose to take short cuts on quality. Leaders should track a balanced set of metrics across four dimensions: (1) value (2) productivity/speed (e.g. cycle time) (3) quality, and (4) team health.

Image by Casey Marshall via Creative Commons BY-2.0 license.